How to Get Every EV Charging Station from OpenStreetMap (as GeoJSON)
Step-by-step guide to pulling EV charging stations from OpenStreetMap for any city or country as GeoJSON: tags, sockets, curl and Python, data quality caveats.
Try it now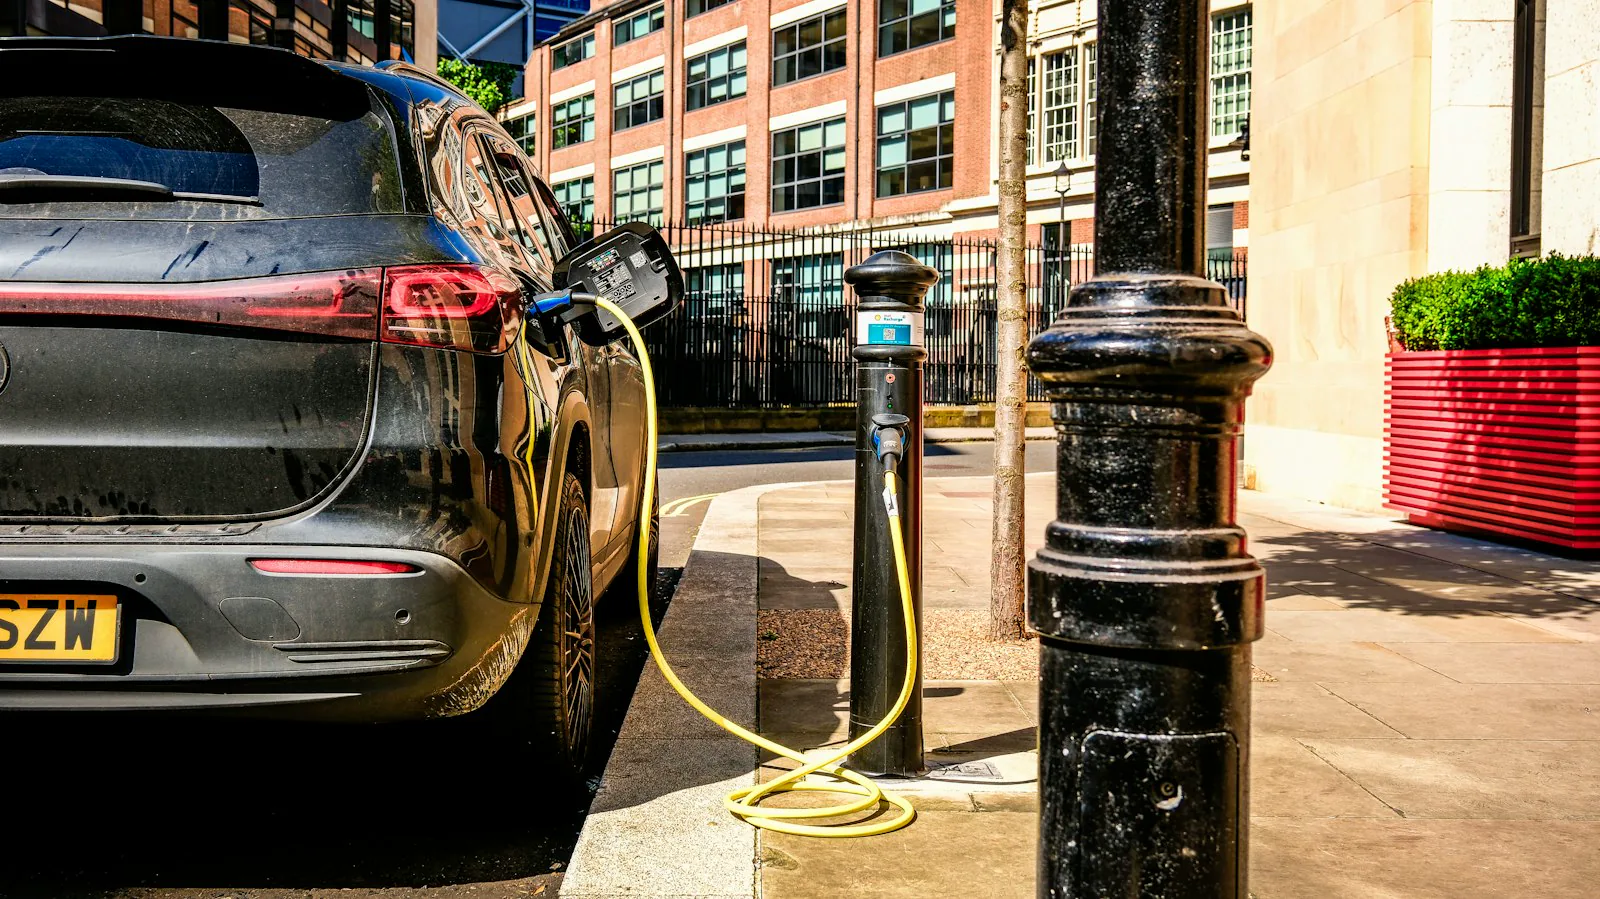
Short answer: EV charging stations in OpenStreetMap are tagged amenity=charging_station. Query that tag inside a city or country boundary and you get every mapped charger as GeoJSON, with connector types in socket:* tags and power output in socket:*:output. OSM tells you a charger exists, not whether it is working, and tagging is uneven: 19% to 45% of chargers in the cities below have no operator tag, so plan to normalize and fill gaps before you aggregate.
OpenStreetMap has over 200,000 mapped EV charging stations worldwide (taginfo counted 209,806 on 2026-11-05). Many come with connector types, power output, operator and fee information, and all of it is open data you can use commercially with attribution. If you are building a charger finder, a route planner, a site-selection model or a coverage report, OSM is one of the few worldwide sources you can download without signing a data agreement.
This guide shows how to pull every EV charging station for a city or a whole country as GeoJSON. It covers which tags matter and how complete the data really is. The examples use the MapLark OSM Features API, but the tagging and data quality sections apply however you get OSM data.
How many EV charging stations are in OpenStreetMap?
These are the amenity=charging_station counts we measured with the count endpoint (see "Count chargers by operator or country" below for the request). Each area is the OSM boundary relation, not a bounding box.
| Area | Charging stations in OSM |
|---|---|
| Sweden | 3,836 |
| Denmark | 3,345 |
| Norway (mainland) | 2,889 |
| California | 2,841 |
| Berlin | 1,775 |
| Finland | 1,391 |
| Los Angeles County | 443 |
| Stockholm Municipality | 95 |
All numbers in this post were collected on 2026-11-05 from MapLark's copy of OSM, which refreshes weekly. OSM changes every day, so your counts will differ.
Coverage is uneven: Sweden has more mapped chargers than California, where the US DOE's AFDC lists over 20,000 public stations. The data quality section below explains the gap.
See EV charger density on a map
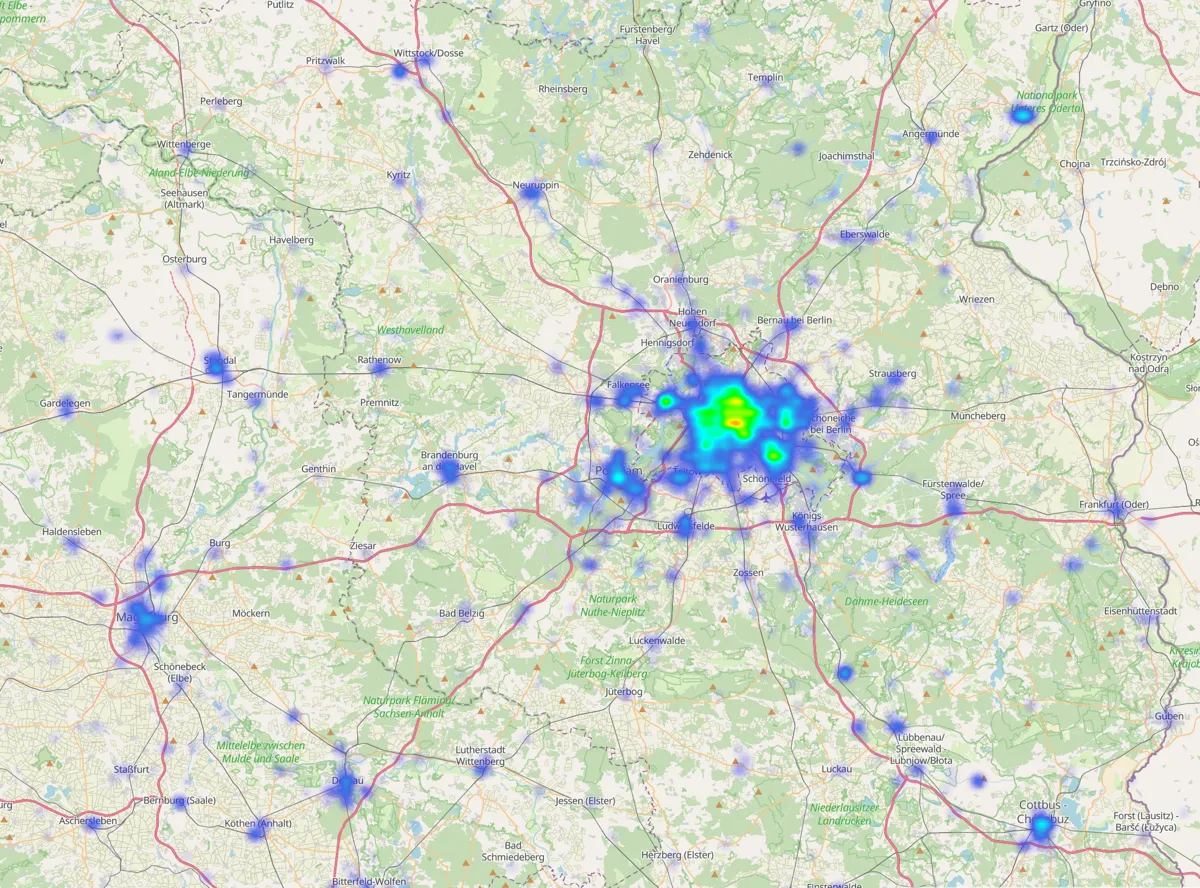
Open the Berlin and Brandenburg charger density map in Overpass Ultra. It shows 4,107 chargers in 1,090 grid cells, drawn as a heatmap weighted by charger count. The link uses the shared free demo key, which is rate limited, so for your own maps create a free key and swap it into the query. Change the bbox, or within=relation/<id>, to map another region.
How EV chargers are tagged
A charging station is amenity=charging_station. It is not only cars: the same tag covers e-bike and scooter charging, and bicycle-only stations should carry motorcar=no. Connector details live in socket:<type> keys with a count as the value, and power is per connector type, not per station. These are the keys worth extracting:
| Tag | What it means | Example |
|---|---|---|
socket:type2 | Type 2 (Mennekes) AC sockets | 2 |
socket:type2_combo | CCS2 connectors (DC fast, Europe) | 4 |
socket:type1_combo | CCS1 connectors (DC fast, North America) | 2 |
socket:nacs | NACS / SAE J3400 (Tesla-style) connectors | 8 |
socket:<type>:output | Max power of that connector type | 150 kW |
capacity | How many vehicles can charge at once | 6 |
operator, brand | Who runs it, and the name on the sign | Ionity |
Live usage counts for every tag are on taginfo, and Geofabrik's regional taginfo breaks them down by country. Two details matter when you write filters:
- There is no
socket:ccsand nosocket:tesla_superchargerin current tagging. Usetype1_comboortype2_combofor CCS, andsocket:nacsfor Tesla-style connectors in North America. The old Tesla keys are marked "please do not use" on the OSM wiki but are still in the data, so for every Tesla site, filter bybrandoroperatortoo. - Multiple values are semicolon-separated. The wiki's example is
socket:type2_combo=6;3withsocket:type2_combo:output=350 kW;90 kW: six 350 kW cables and three 90 kW cables.
Data quality: what to expect
OSM charger data is good, uneven, and getting better. Plan for these issues before you put it in front of users.
Coverage varies by country and region. OSM depends on local mappers and, in some places, imports from open registries. A quick comparison shows how big the gap can be. OSM had 2,841amenity=charging_station features in California. The US Department of Energy's AFDC station API reported 20,393 open public EV charging stations in the state. The definitions differ (AFDC counts station locations, and OSM may map one site as one station), but a gap that size is a coverage gap. For scale, OSM has more mapped chargers in Sweden than in the far more populous state of California.
Tag completeness is patchy. Here is the share of the 95 stations in Stockholm Municipality that carry each tag:
| Tag | Present on |
|---|---|
capacity | 85% |
operator | 63% |
brand | 32% |
fee | 23% |
access | 22% |
any socket:* count | 21% |
any socket:*:output | 13% |
opening_hours | 1% |
any authentication:* | 1% |
So a "show me CCS chargers over 150 kW" filter will silently drop most stations, not because they lack CCS, but because nobody tagged it. Show "unknown" in your UI instead of hiding untagged stations. The gaps vary by region: about 28% of Swedish and 45% of Los Angeles County chargers have no operator tag (counts below).
Taginfo shows the same pattern worldwide. Of 209,806 charging stations, 72% have capacity, 70% have operator, 49% have fee, 31% have opening_hours, 15% have socket:type2_combo and 17% still use the messy network key. For one country, use the Geofabrik taginfo for Sweden: it lists 3,863 stations, 72% with operator, which matches our 28% missing.
Values are inconsistent. In the same Stockholm set, socket:type2_combo:output appears as both 50 kW and 50. Expect deprecated socket keys, semicolon lists, and operator names spelled several ways (Mer vs Mer Connect Sverige). Normalize before you aggregate.
capacity is hard to know. The wiki notes that capacity depends on the number of EVSEs, not cables, which is often not visible on site. Treat it as an estimate.
No live status. OSM tells you a charger exists, not whether it is free or working right now. For availability, you need operator feeds (often via OCPI) or a registry that publishes status.
How OSM compares with other EV charger sources
OSM is rarely the only source you need. Two common comparisons:
| Source | Coverage | Licence and access | Notes |
|---|---|---|---|
| OpenStreetMap | Worldwide, uneven | ODbL; attribute "© OpenStreetMap contributors" | Rich tags, geometry, weekly or faster updates depending on your provider |
| Open Charge Map | Worldwide | User-contributed data is CC BY 4.0; imported third-party data keeps the provider's licence; API key required | Full data snapshots are published on GitHub for heavy users |
| AFDC (US DOE) | US and Canada | Free API key from the NLR (formerly NREL) developer network | Filters for connector, network and charging level; OSM links via ref:afdc |
Many production apps merge sources: a registry or operator feed for coverage and live status, and OSM for geometry, tags and countries where no registry exists.
Get a key and pick an area
Every example below uses YOUR_KEY as a placeholder, so create a free key and swap it in. The Free plan includes 30,000 credits a month at 5 requests per second, no Overpass QL required.
Every example below is a variation on one endpoint, GET /v3/osm_features, so jump to whichever fits your task. First, pick an area. You have three options:
bbox=min_lon,min_lat,max_lon,max_latfor a rectanglelocation=lat,lng&radius=metresfor a circlewithin=relation/<id>for "inside this OSM boundary", such as a city or municipality
within is the cleanest choice for a city. To find the relation ID, search for the place on openstreetmap.org, open the boundary result, and copy the number from the URL. Stockholm Municipality is relation/398021.
Download every charger in a city
With curl, or with the Python SDK (pip install osmfeatures), which also saves the GeoJSON and flattens the useful tags into rows. Switch tabs to compare:
curl -G "https://api.maplark.com/v3/osm_features" \
  --data-urlencode "within=relation/398021" \
  --data-urlencode "tags=amenity=charging_station" \
  -H "Authorization: Bearer YOUR_KEY" \
  -o stockholm_chargers.geojson
import json
from osmfeatures import OSMFeaturesClient
API_KEY = "YOUR_KEY"
with OSMFeaturesClient(api_key=API_KEY) as client:
fc = client.query(
within="relation/398021", # Stockholm Municipality
tags=["amenity=charging_station"],
)
print(len(fc["features"]), "charging stations")
with open("stockholm_chargers.geojson", "w") as f:
json.dump(fc.to_dict(), f)
rows = []
for feat in fc["features"]:
t = feat["properties"]["tags"]
rows.append({
"id": feat["id"],
"operator": t.get("operator") or t.get("brand"),
"capacity": t.get("capacity"),
"type2": t.get("socket:type2"),
"ccs": t.get("socket:type2_combo"),
"ccs_kw": t.get("socket:type2_combo:output"),
"fee": t.get("fee"),
"access": t.get("access"),
}) The request returns a GeoJSON FeatureCollection. Each feature has an id like node/11293052705, a geometry, and the OSM tags under properties.tags:
{
  "type": "Feature",
  "id": "node/11293052705",
  "geometry": { "type": "Point", "coordinates": [18.0884415, 59.3250314] },
  "properties": {
    "tags": {
      "amenity": "charging_station",
      "capacity": "2",
      "socket:type2": "2",
      "socket:type2:output": "22 kW",
      "socket:type2:current": "32"
    }
  }
}
The response headers tell you what happened: x-returned (feature count), x-has-more (whether a lower limit truncated the result) and x-usage-units-charged (credits used). This Stockholm request returned 95 stations and cost 3 credits.
Want a different format? Set the Accept header: text/csv, application/flatgeobuf or application/vnd.apache.parquet for GeoParquet, which DuckDB and GeoPandas read directly.
From the Python rows, pandas.DataFrame(rows) or geopandas.read_file("stockholm_chargers.geojson") gets you into the usual tools. Power values are strings like "150 kW" (and sometimes "150" or "50;22 kW"), so parse them yourself before you compare numbers. The npm package works the same way: npm install osmfeatures, then client.query({ within: ..., tags: [...] }). See the docs for the TypeScript quick start.
Filter by connector type
The tags parameter takes the tags query language: , is AND, | is OR, ! negates one clause. Only stations that have CCS2 connectors tagged:
curl -G "https://api.maplark.com/v3/osm_features" \
  --data-urlencode "within=relation/398021" \
  --data-urlencode "tags=amenity=charging_station,socket:type2_combo" \
  -H "Authorization: Bearer YOUR_KEY"
Or all DC fast charging, whatever the plug (and without bicycle-only chargers):
--data-urlencode "tags=amenity=charging_station,(socket:type2_combo|socket:type1_combo|socket:chademo|socket:nacs)" Not in a boundary? Use a radius instead, for example every charger within 5 km of a point: location=59.334,18.063&radius=5000.
The same query in Overpass QL
The equivalent Overpass QL for Stockholm Municipality (an Overpass area ID is the relation ID plus 3,600,000,000):
[out:json][timeout:60];
area(id:3600398021)->.stockholm;
nwr["amenity"="charging_station"](area.stockholm);
out center tags;
Overpass answers in its own JSON format, not GeoJSON, and public servers are shared and rate limited, so large or repeated pulls are better run on your own instance or a hosted API.
Count chargers by operator or country
Before you download anything big, count it. The count endpoint, GET /v2/osm_features/count, returns no geometry, so it accepts much larger areas than the GeoJSON endpoint. The docs say a Sweden-sized tagged count fits every tier.
Chargers per operator in Sweden:
curl -G "https://api.maplark.com/v2/osm_features/count" \
  --data-urlencode "within=relation/52822" \
  --data-urlencode "tags=amenity=charging_station" \
  --data-urlencode "group_by=operator" \
  --data-urlencode "limit=10" \
-H "Authorization: Bearer YOUR_KEY"{"groups":[{"value":"Mer","count":141},{"value":"E.ON","count":92},{"value":"Tesla","count":91},
{"value":"Vattenfall InCharge","count":88},{"value":"Göteborgs Stads Parkerings AB","count":74}, ...],
"total":2769,"truncated":true} Note total is 2,769, not Sweden's 3,836 stations: with group_by, only features that have the key are counted. That gap is your first data quality number. About 28% of Swedish chargers in OSM have no operator tag.
Comparing countries in Python:
from osmfeatures import OSMFeaturesClient

COUNTRIES = {
    "Sweden": "relation/52822",
    "Norway (mainland)": "relation/1059668",
    "Finland": "relation/54224",
    "Denmark": "relation/50046",
}

with OSMFeaturesClient(api_key="YOUR_KEY") as client:
    for name, rel in COUNTRIES.items():
        total = client.count(within=rel, tags=["amenity=charging_station"])["total"]
        ccs = client.count(within=rel, tags=["amenity=charging_station,socket:type2_combo"])["total"]
        print(f"{name:18} {total:>6} stations  {ccs:>6} with CCS tagged")
Output:
Sweden               3836 stations     814 with CCS tagged
Norway (mainland)    2889 stations    1706 with CCS tagged
Finland              1391 stations     387 with CCS tagged
Denmark              3345 stations    1168 with CCS tagged
Two practical notes. Norway's main boundary (relation/2978650) includes far-flung territories, and its envelope is larger than the API's 80° per-axis limit, so we used the mainland relation. For a US city, county or state, use that place's relation the same way.
Los Angeles County, as a US example
Los Angeles County is relation/396479. It has 443 charging stations. That sits inside the same state as the 2,841 California stations counted. Chargers per operator:
curl -G "https://api.maplark.com/v2/osm_features/count" \
  --data-urlencode "within=relation/396479" \
  --data-urlencode "tags=amenity=charging_station" \
  --data-urlencode "group_by=operator" \
  --data-urlencode "limit=10" \
-H "Authorization: Bearer YOUR_KEY"{"groups":[{"value":"Tesla, Inc.","count":72},{"value":"Tesla","count":37},{"value":"ChargePoint","count":36},
{"value":"EVgo","count":24},{"value":"FLO","count":15}, ...],
"total":243,"truncated":true} Note total is 243, not the county's 443 stations: with group_by, only features that have the key are counted. About 45% of Los Angeles County chargers in OSM have no operator tag. OSM mappers tag Tesla two ways, so merge operator variants when you aggregate: Tesla, Inc. 72 plus Tesla 37 is Tesla 109, then ChargePoint 36, EVgo 24 and FLO 15.
aliases = {"Tesla, Inc.": "Tesla"}
merged = {}
for row in histogram["groups"]:
    key = aliases.get(row["value"], row["value"])
    merged[key] = merged.get(key, 0) + row["count"]
# Tesla 109, ChargePoint 36, EVgo 24, FLO 15
Download a whole country or region
The GeoJSON endpoint caps the area of one request, and higher plans allow larger query areas. A Los Angeles County bbox covering the mainland basin (Palos Verdes and Long Beach through the San Fernando Valley) is about 0.91 square degrees, so it is too big for one call. The Python SDK still fetches the whole bbox: pass auto_split=True on client.query and it splits along the longest side until each tile fits your plan, then merges the tiles and de-duplicates by OSM id.
This downloads every charging station in that Los Angeles basin bbox:
import json
from osmfeatures import OSMFeaturesClient

# Mainland Los Angeles County basin (relation/396479 envelope)
# Palos Verdes / Long Beach through the San Fernando Valley
LA_BBOX = "-118.9517221,33.65,-117.6462700,34.35"

with OSMFeaturesClient(api_key="YOUR_KEY") as client:
    fc = client.query(
        bbox=LA_BBOX,
        tags=["amenity=charging_station"],
        auto_split=True,
    )

print(len(fc["features"]), "charging stations")

with open("la_chargers.geojson", "w") as f:
    json.dump(fc.to_dict(), f)
That call returned 609 stations in 16 tiles and cost 45 credits. That is more than the county-polygon count of 443 because the bbox also covers neighbouring areas outside relation/396479.
For a whole country, 16 tiles is not enough. A better approach is to ask where the chargers are first, then fetch only those cells. The density endpoint returns a grid of occupied cells:
import json
import time
from osmfeatures import OSMFeaturesClient

AREA = "relation/52822"                # Sweden
TAGS = ["amenity=charging_station"]
CELL = 0.2                             # 0.2° x 0.2° = 0.04 sq deg, fits the Free tier cap

with OSMFeaturesClient(api_key="YOUR_KEY") as client:
    # 1. Which grid cells contain at least one charger?
    grid = client.density(within=AREA, tags=TAGS, type=["node", "way"], cell_deg=CELL)
    print(grid["total"], "chargers in", len(grid["features"]), "cells")

    # 2. Fetch each occupied cell as a small bbox, de-duplicating by OSM id
    features = {}
    for cell in grid["features"]:
        lon, lat = cell["geometry"]["coordinates"]
        h = CELL / 2
        bbox = f"{lon - h},{lat - h},{lon + h},{lat + h}"
        fc = client.query(bbox=bbox, tags=TAGS, type=["node", "way"], centroid=True)
        for f in fc["features"]:
            features[f["id"]] = dict(f)
        time.sleep(0.15)               # stay under the per-second rate limit

with open("chargers.geojson", "w") as out:
    json.dump({"type": "FeatureCollection", "features": list(features.values())}, out)
For Sweden, the density call found 3,836 chargers in 606 occupied cells, so the full download is about 600 small requests instead of thousands of empty tiles. The density call cost about 800 credits and the small cell requests a few credits each, so the whole country fits the Free plan's monthly budget. Border cells reach into neighbouring areas, so filter by point-in-polygon if you need an exact boundary.
If you pull country-scale data every week, Pro gives you a bigger tile cap (fewer requests), 20 requests per second and 260,000 credits a month.
FAQ
How do I get only Tesla Superchargers?
Filter on brand or operator: tags=amenity=charging_station,(brand=Tesla|operator=Tesla). Use both, because mappers are inconsistent: in Sweden, 91 stations have operator=Tesla but only 14 have brand=Tesla. In Los Angeles County the count endpoint returns both Tesla, Inc. (72) and Tesla (37); add them to 109 before you rank operators. Check spellings in your region with group_by=operator first. Don't rely on socket:tesla_supercharger: the wiki marks it as deprecated in favour of socket:nacs or socket:type2_combo.
How fresh is the data?
MapLark refreshes its OSM copy weekly. That suits charger finders and analysis. If you need edits to appear within minutes, run the Overpass QL query above against a minutely updated Overpass instance.
Can I use this from an AI agent?
Yes. The MCP server exposes the same queries to Claude, Cursor and other MCP clients, billed against the same key.
Get your first charger dataset in a minute
Sign up free for 30,000 credits a month, run the Stockholm curl above with your key, then swap in your own city's relation ID. When you move to weekly country-scale pulls or a production app, Starter at $29/month adds larger tiles, higher rate limits and 75,000 credits.
Useful next reads:
- Filter OSM features with AND, OR, NOT and regex
- OSM vector tiles vs a features API (Overpass alternative)
- PostGIS schema: how the three geometry tables affect query speed
- Developer docs and code examples
Map data © OpenStreetMap contributors, available under the Open Database Licence.
Get chargers as GeoJSON
Run a query in the live demo, then grab a free API key.